30 December 2008

Solving a Three-Good Utility Function

According to the principles of Neoclassical economics, we would turn to a utility function of three variables to investigate.1 Usually, the concept is explained with two goods so it can be illustrated (x and y being goods, and z—the vertical axis—standing for utility). But we can't illustrate this one fully because we are interested in cases where there are actually more than two goods determining utility.

Let U be utility as a function of x, y, and z, where x refers to everything one buys other than software, y is cheap software, and z is costly software (α, β, and γ are arbitrary constants; x0, y0, and z0 are threshold levels of consumption) .

U(x, y, z) = αln(x-x0) + βln(y-y0)+ γln(z-z0)

subject to
I = pxx + pyy + pzz .

where I is income and p refers to the price of the respective good.


The Lagrangian will be


L = αln(x-x0) + βln(y-y0)+ γln(z-z0) + λ(I - pxx - pyy - pzz)

and first order conditions will be


First we solve for x, y, and z in terms of the constants (and λ)

and then we solve for the Lagrangian multiplier λ:


And we substitute the values for x, y, and z into the equation for the Lagrangian multiplier.


Now, so far this has just been a generic solution of a symmetric 3-good constrained optimization problem, and it can be made even more general for a very large number of goods:


where gj is any good, cj is the corresponding constant I've been representing with Greek letters, I is income, and i is the counter for summation within the equation (So, for example, pj refers to the price for the good gj whose optimal amount g* you're trying to determine, while pigi refers to the amount expended on any individual good listed in the summation from 1 to n goods).

(Discussion of Findings)


Notes:

1 Regarding the utility function: I prefer to use the linear expenditure model instead of the Cobb-Douglas model everyone else uses, because the CD utility function leads to rigid expenditures between x, y, and z. If a researcher wanted to perform regression analysis of "observed preferences" to establish what the coefficients were, the existence of threshold levels of consumption would correspond to y-intercepts for each good.

Labels: ,

29 December 2008

Pay-per-use your own computer?

Gregg Keizer, Microsoft specs out 'pay as you go' PC scheme, Computerworld

The idea is something that might have been a story problem in a class on welfare economics: assuming the cost of metering computer usage is negligible, discuss the merits of such a proposal. MS filed a patent for a proposal to sell computers (presumably well below the cost of production), then bill customers for both the use of installed programs and the use of computer power.
Microsoft's plan would instead monitor the machine to track things such as disk storage space, processor cores and memory used, then bill the user for what was consumed during a set period.
So you would be billed x per MIPS-hour, even though this would require you to have the highest-performing processor installed all the time. Also, it would allow you to briefly use premium softwares for hourly (?) rates.

At first blush, this does sound a lot like MS is at it again, trying to squeeze more revenue out of customers for software that is costlier and buggier. A major benefit for MS would be stimulating computer revenue by offering pay-per-use options; note there's an extremely severe recession approaching. With respect to hardware, there would be an obvious relative increase in the incentive to get the most powerful devices, since there would not be a price premium... except on the occasion that you used their full capability. Semiconductor fabricators like AMD might grumble about the price squeeze value-added retailers like Dell were imposing, but really, they'd really only need to ship a larger number of top-of-the-line chips, rather than a mix of different premium chips.

Where the idea gets interesting is software, since the object would be to create a market for much higher-end programs (most likely games, but also business applications). MS could allow users to download "riskfree" programs that had been recently developed, collect revenues, and perhaps stimulate demand. Which opens the question, what exactly would this scheme do for software demand?

Solving a Three-Good Utility Function
Section excised and put in another post

Findings

Usually discussion of utility functions present them as indifference curves between two similar goods. I prefer to think of utility functions as part of firm's production function, in the sense that there's more money to be made with an optimal expenditure on different items. But in the case of an actual business strategy, it makes sense to begin with the understanding that customers can spend money on
  1. high-end software (z)
  2. low-end software (y)
  3. everything else (x).
Usually I use the x-axis to represent "everything else" (example). Textbook writers, sometimes in an effort at humor, will select two very similar items (pizza versus hamburgers) , but assume consumers' expenditures on the two items together will remain the same regardless. I remain curious, though, as to what would happen if you're looking at a market for two similar items, in which most income will be spent on neither. If the price for one goes down, demand for the other may not necessarily go down (as it would if there were only two items).

Another deviation from usual practice is to use the linear expenditure function instead of a Cobb-Douglas function. The Cobb-Douglass utility function is unappealing to me because, while it's easy to use mathematically, it results in a fixed share of income being spent on each good. Logically, if the price of a thing is sharply reduced, you would expect people to spend a larger share of their income on that thing; spending the same amount of money as before now yields more satisfaction, so people will find more occasions to use spend more money on it, not merely buy more units. For some products, the opposite may be true (health care), in which case the threshold level of consumption can be made negative.

The threshold level of consumption is a phrase I made up to refer to what x0, yo, and zo represent: a minimum level of consumption of these respective goods. Consumption of x < x0 means that x ties up income but contributes nothing to utility. As is often the case, extreme conditions are seldom relevant: we aren't usually interested in situations where x < x0. Instead, we're interested in situations where x >> x0, and we're making a modest shift in position. Technically, a negative threshold level of consumption implies that even negative consumption of a thing contributes to utility, to say nothing of no consumption at all. That's absurd. On the other hand, the curve created by a negative threshold may realistically describe conditions in which an increase in prices leads to an increase in total expenditures.


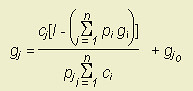
I set up the equation so that threshold levels of consumption were positive for all goods; the price of "everything else" was fixed; high-end software yielded a higher utility per unit, and software generally had a higher utility per unit than "everything else." I found that increasing prices for y actually reduced spending (demand) for z, albeit much more slowly than reducing the price for z.

A lot of this has to do with the coefficients of the utility function: α, β, γ, x0, yo, zo, and I. The values of α, β, and γ determine the gradient of the utility function at I. When creating the graph above, I chose values for β and γ that were much higher than α; that reflects an assumption that ongoing expenditures on low-end software (not to mention high-end software) provide more bang for the buck than money spent on "everything else." That's an intensely controversial proposition, but I doubt it would face controversy at Microsoft.

The values for threshold spending (x0, yo, and zo) are naturally a mystery; high values for x0 and yo (i.e., both "everything else" and low-end software) lower z*, while high values for zo increase z*. All this means is that, if thresholds are high, a price reduction causes expenditures on the good to increase. If threshold = 0, then a price reduction causes expenditures to stay the same. For computers generally, there is strong historic evidence that falling prices have sharply increased expenditures, leading to the conclusion that the threshold value is large but is offset by a high coefficient of utility.

The effect of the original business scheme of Microsoft would lead to a shift in software expenditure from low-end software to high-end, and stimulate spending on software generally. The logic of this is intuitive: access to high-end functionality would be on tap, but users would not have to actually commit to owning the whole package. This would increase the overall utility of software per se.

Labels: , , , , ,

21 December 2008

Parenthetic Note on the Use of the Atomic Bomb

I recently wrote a post on the Manhattan Project in which I wrote:
I've been disappointed by the way the issue has been generally exploited by partisans to support opinions on other subjects—a football, so to speak, in an ongoing propaganda war. As an amateur student of history, I personally have learned that it's vain and self-deceiving to make judgments on these matters because one cannot (or will not) ever make a valid reconstruction of the understanding historical actors had of the events in which they acted...


The Manhattan Project emerged from under this avalanche of history as the prototypical project to use a massive drive to develop a "magic bullet," a technology that would end the War. Somehow, that technology has been divorced from any context. I guess people want to conjure up the amazing technical feat of not only achieving a nuclear bomb in only three years, but achieving the first nuclear bomb in only three years; and applying this to some unknown new technology, similar to the A-bomb in its revolutionary character, but reversing the moral polarity.
My post neglected to explain why I was disappointed; it was not by the fact that people try to make judgments on "these matters." It was how they go about it.

In American Hiroshima (Trafford Publishing, 2006; p.108ff), David J. Dionisi makes a fairly compelling argument that the US government was well aware of the inevitability of Japanese capitulation well before the use of the bomb. The customary evidence for this (it's been made many times before) is the 1946 US Strategic Bombing Survey, "Japan's struggle to end the war.":
Read more »

Labels: , ,

03 December 2008

Counting the Cost: the Financial Crisis

Disclaimer: I am not an expert in this field; these are my notes as I research these topics using the usual internet/public library resources. In many cases, links have been added to subsequent posts in this blog. Apologies in advance for any mistakes of interpretation.

How much will the financial crisis cost the US taxpayer? Most of the attention has focused on the Troubled Asset Relief Program (TARP), a $700 billion package initially designed to restore financial markets by buying up troubled assets. That's understandable, but it mainly reflects Congressional debate over a smallish share of the overall government response. According to Barry Ritholtz, et al., that government response was predominantly administered by the Federal Reserve System, and is measured by capital stakes.

An additional component of the bailout, also far surpassing the TARP agreement, is outlays by the Federal Deposit Insurance Corporation (FDIC). The FDIC approved the Temporary Liquidity Guarantee Program (TLGP) in October; it provides a guarantee of non-interest bearing deposits up to $250,000 instead of the usual $100,000.

TARP and the FHA "Hope for Homeowners" programs were designed mainly to inject a stream of payments into the huge pool of obligations taken on by federally guaranteed agencies.

Here follows a review of the items on Ritholtz's list.

Federal Reserve System

The Federal Reserve System took on potentially $5.8 trillion in liabilities in response to the initial wave of banking failures. Here are the programs it has created for coping with the catastrophe.

  • Commercial Paper Funding Facility: created 7 October 2008, shortly after a disastrous meltdown of the commercial paper markets (Bloomberg; see chart). Accepts newly issued 3-month unsecured and asset-backed CP from eligible issuers as collateral in exchange for funds (3 months).
  • Term Auction Facility: created 12 December 2007. Up to 90 loans to depository institutions (thrifts, savings banks, credit unions) for emergency reserves, supplementing the usual interbank reserve lending. Not a permanent institution, but a series of auctions of funds held every two weeks. The banks successfully bidding must provide suitable securities as collateral.
  • Money Market Investor Funding Facility: created 21 October 2008 to provide liquidity to money market funds; object to prevent sales of assets in falling market (debt deflation).
  • MBS Purchase Program: created November 2008 to buy mortgage-backed securities from FNMA, and FHLMA (Fannie Mae, and Freddie Mac; known collectively as the GSEs). This was intended take the place of the suddenly-defunct market for MBS collateralized debt obligations (CDOs). This is not the same thing as the project of re-absorbing the GSEs themselves. In terms of financial risk, this is probably qualitatively riskier than the other programs.
  • Term Securities Lending Facility (TSLF): created 11 March 2008 & renewed 3 December; lends Federal Reserve holdings of US Treasury securities to NY Fed primary dealers.
  • Term ABS Lending Facility (TALF): created 25 November 2008; loans to entities buying asset-backed securities (ABS); borrowers required to not be originators of the ABS.
  • Credit Extensions (mostly AIG): large number of different interventions to salvage network of CDS counterparty liabilities; includes at least $122 billion (apparently, not the same money as the $150 billion of TARP funds authorized as of 9 November specifically for AIG). Most money ever directed by the USG to any single enterprise (NY Times).

Federal Deposit Insurance Corporation

The Temporary Liquidity Guarantee Program (TLGP) was rated at costing potentially $1.4 trillion, although so far it has not cost anything yet--it is an extremely new program, and we don't know how many banks are likely to default on their largest deposits.

The FDIC also provided Citigroup with $306 billion in loan guarantees (Bloomberg), with Citigroup required to absorb the first $29 billion in losses, and 10% of losses after that--for a potential maximum liability to the FDIC of $249.3 billion. The FDIC provided a similar loan guarantee of $139 billion to General Electric (Bloomberg). Ritholtz lists the current amount for this line item as 100% of the maximum, which presumes an implausibly disastrous collapse of Citigroup and General Electric asset value.

US Treasury

It may come as a surprise to learn that the Treasury Department's role in the federal government response to the financial crisis was small potatoes. There are two main programs, the Troubled Asset Recovery Program (TARP) and the GSE bailout (separate and distinct from the MBS purchase program).

SOME REMARKS

This is where I was supposed to carefully review all of the programs and their interplay, and make some assessments. One meta-assessment is that James Hamilton of Econbrowser (7 October) was unable to say, and he really is an expert (I'm just trying to learn about this). The reason is that the financial system has certain metaphysical obstacles to consequential analysis: there's no agreement on what this relationship of debt to economic output really means.

Having examined several of the programs set up by the Federal Reserve and the Treasury, I think I can understand why the approach taken was so complex: each industry had to be treated differently. For example, while money market funds usually rely on commercial paper markets for investor return, they have constraints and problems that are distinct enough to need different approaches. But the complicated arrangement of credit triage supplied by the Fed to its [still more] complicated patient means unpredictable results and unpredictable market response.

When I was studying theories of monetary policy, like the debate over "commitment versus discretion" (see Dotsey 2008), the papers and textbooks described a world of macroeconomic stability. A bad monetary policy might lead to a monotonic increase in bond yields, but it was a well-behaved catastrophe. I understood that this was an introduction to the idea, and meant to help students understand the basic terms of the debate, but it did not occur to me that the real controversy would erupt during a multi-dimensional crisis in which many different financial markets were flying apart. Here, there were no rules to commit to: the contribution of economic theory to debate in this crisis has been to grumble about moral hazard.

What we are really discussing here is something that economic theories do not describe in any meaningful sense of the word "describe," and something more akin to a turbofan engine. Except that a turbofan engine was designed and produced by a single firm, and its operating principles are well known to the designers or mechanics. The financial system was designed by no single entity, and its relationship with the real economy is mired in doubt.

Having said that, it seems to me that a big part of the rescue program sketched above is multiple layers of liability. A homeowner borrows money from a mortgage originator, who sells the mortgage to an investment bank. The investment bank creates an SIV and sells the mortgage to it, in exchange for a stream of payments to depositors. The mortgage may be insured against default with a credit default swap, whose counterparty is a hedge fund. The hedge fund may hedge its CDS liabilities with put options on the same CDO, and the counterparty to the puts may be another investment bank that finances with commercial paper. That commercial paper, finally, finances the original homeowner's money market fund. The same liability is repackaged, leveraged, and perhaps even multiplied through options and credit default swaps.

The Fed's program, in effect, rescues each layer. Party A uses some federal funds to repay B, who uses that plus more federal funds to repay C, and so on. This increases the Fed's exposure but reduces the unit risk of that exposure.

However, it seems clear that this post can never be more than a bookmark, which I will need to revisit as the situation unfolds.


Sources & Additional Reading

Barry Ritholtz, "Calculating the Total Bailout Costs" and "$7.8 Trillion Total Bailout Commitment," The Big Picture (November 2008)
Bloomberg:
Econbrowser (James Hamilton's blog)Federal Reserve System sites:
Marco Arnone & George Iden, "Primary Dealers in Government Securities: Policy Issues and Selected Government's Experience" Working Paper, International Monetary Fund (March 2003)

"Financial Crisis – News and Resources" page at Morrison & Foerster, LLP website (outstanding!)

Andrew Ross Sorkin & Mary Williams Walsh, "AIG May Get More in Bailout," New York Times (9 Nov 2008)

Joe Weisenthal, "Explaining The AIG Black Hole," Business Insider (30 October 2008)

Neil Irwin, "Fed Prepared to Prop Up Money-Market Funds," Washington Post (22 October 2008)

Labels: , ,